Skip to content

WolkAbout

Three years on an IoT platform, from junior developer to team lead.

2017 to 2020 · Frontend engineer, junior to senior, then team lead

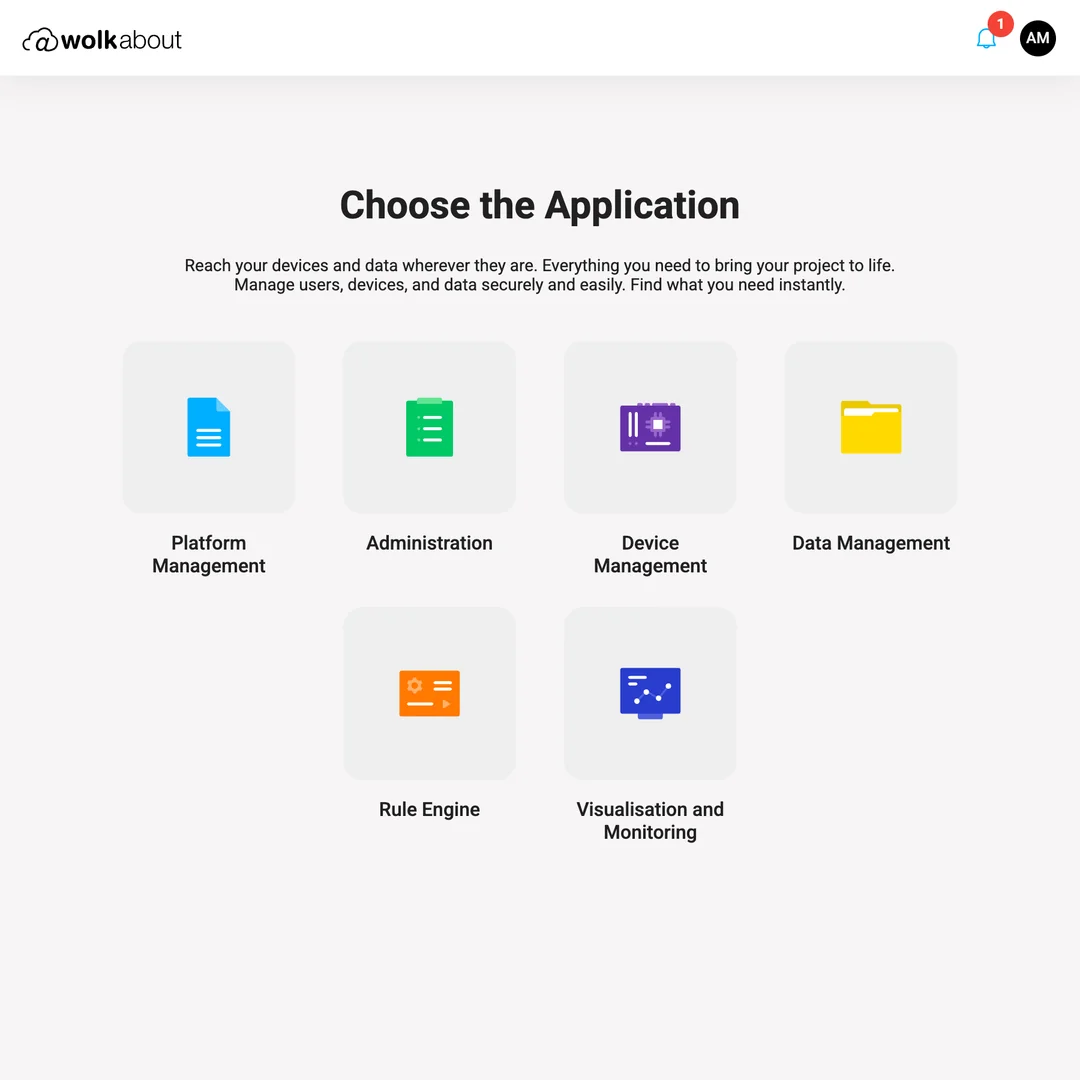
The launcher, a dashboard, the devices, one device, the messages and a rule. Run in 2026 from a 2021 build, with invented data.
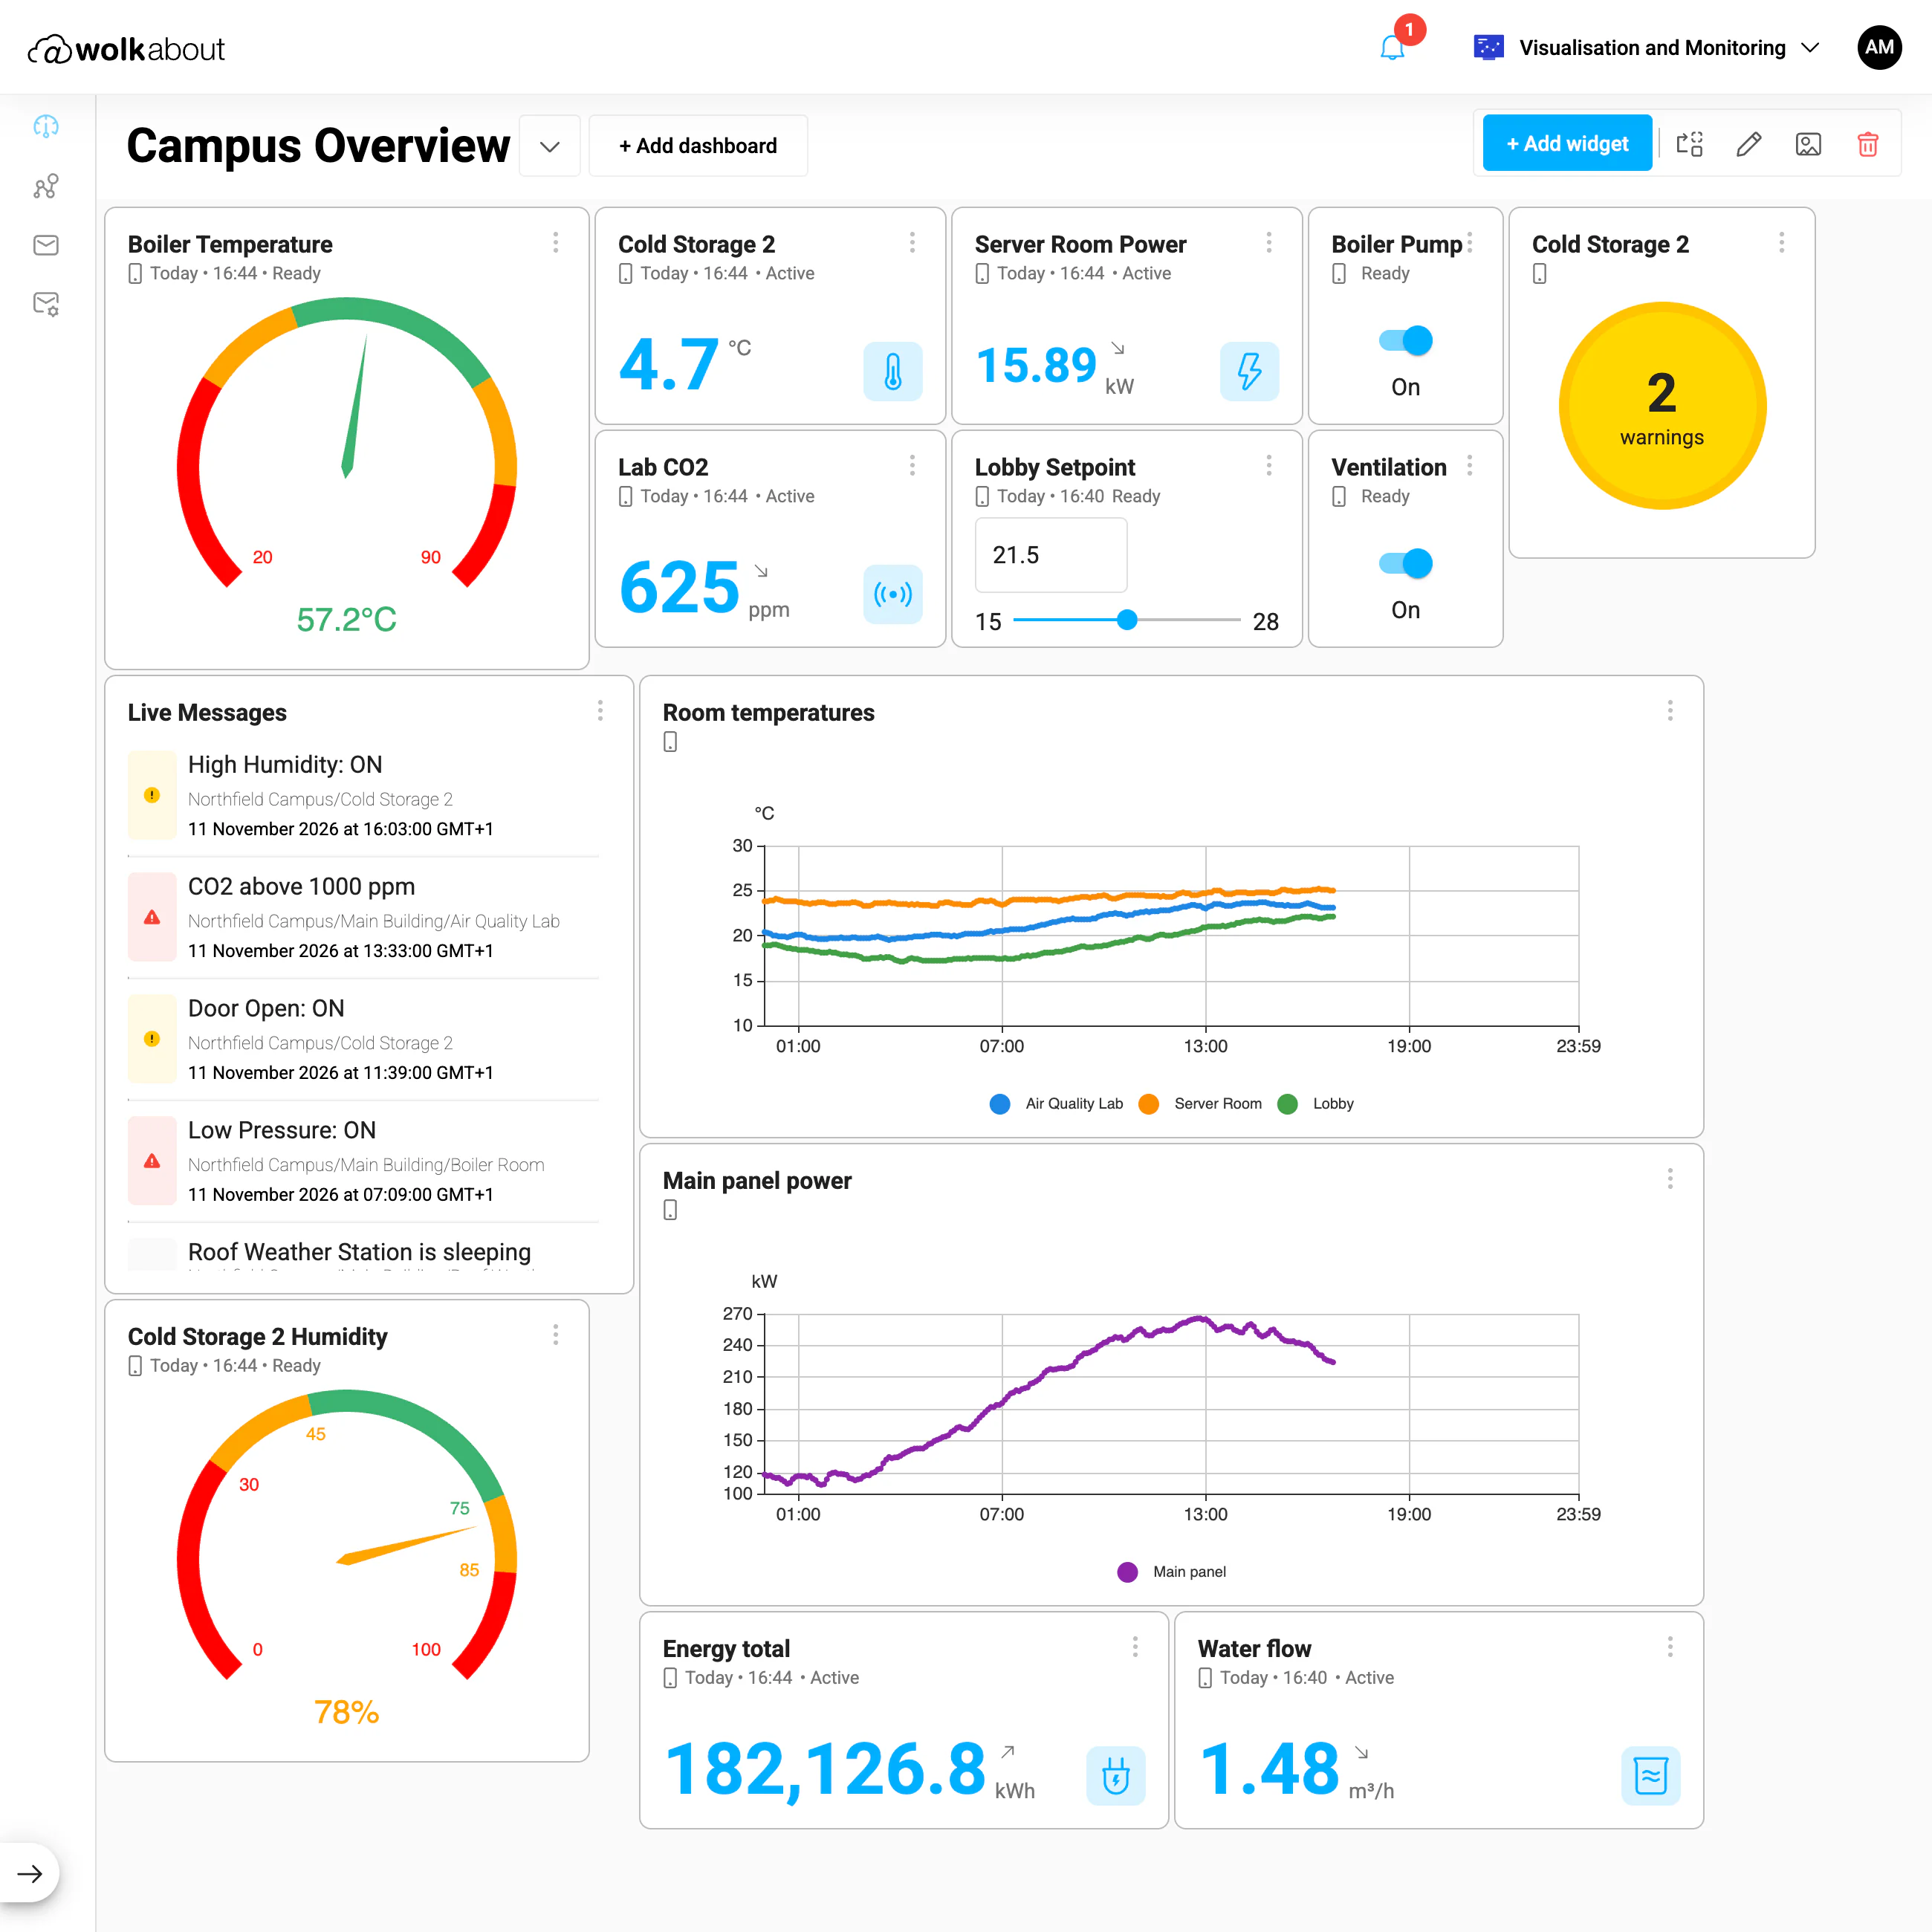
The WolkReact dashboard "Campus Overview": a boiler temperature gauge at 57.2 °C, readings for a cold store, server-room power and lab CO2, two switches set to On, a setpoint slider, a "2 warnings" status badge, a list of live messages such as "High Humidity: ON" and "CO2 above 1000 ppm", charts of room temperatures and main panel power over a day, a humidity gauge at 78%, and readings for total energy and water flow, for an invented tenant called Northfield Campus.
A dashboard of typed widgets: gauges, readings, a switch, a setpoint, trend charts and live messages. Run in 2026 from a 2021 build, with invented data.
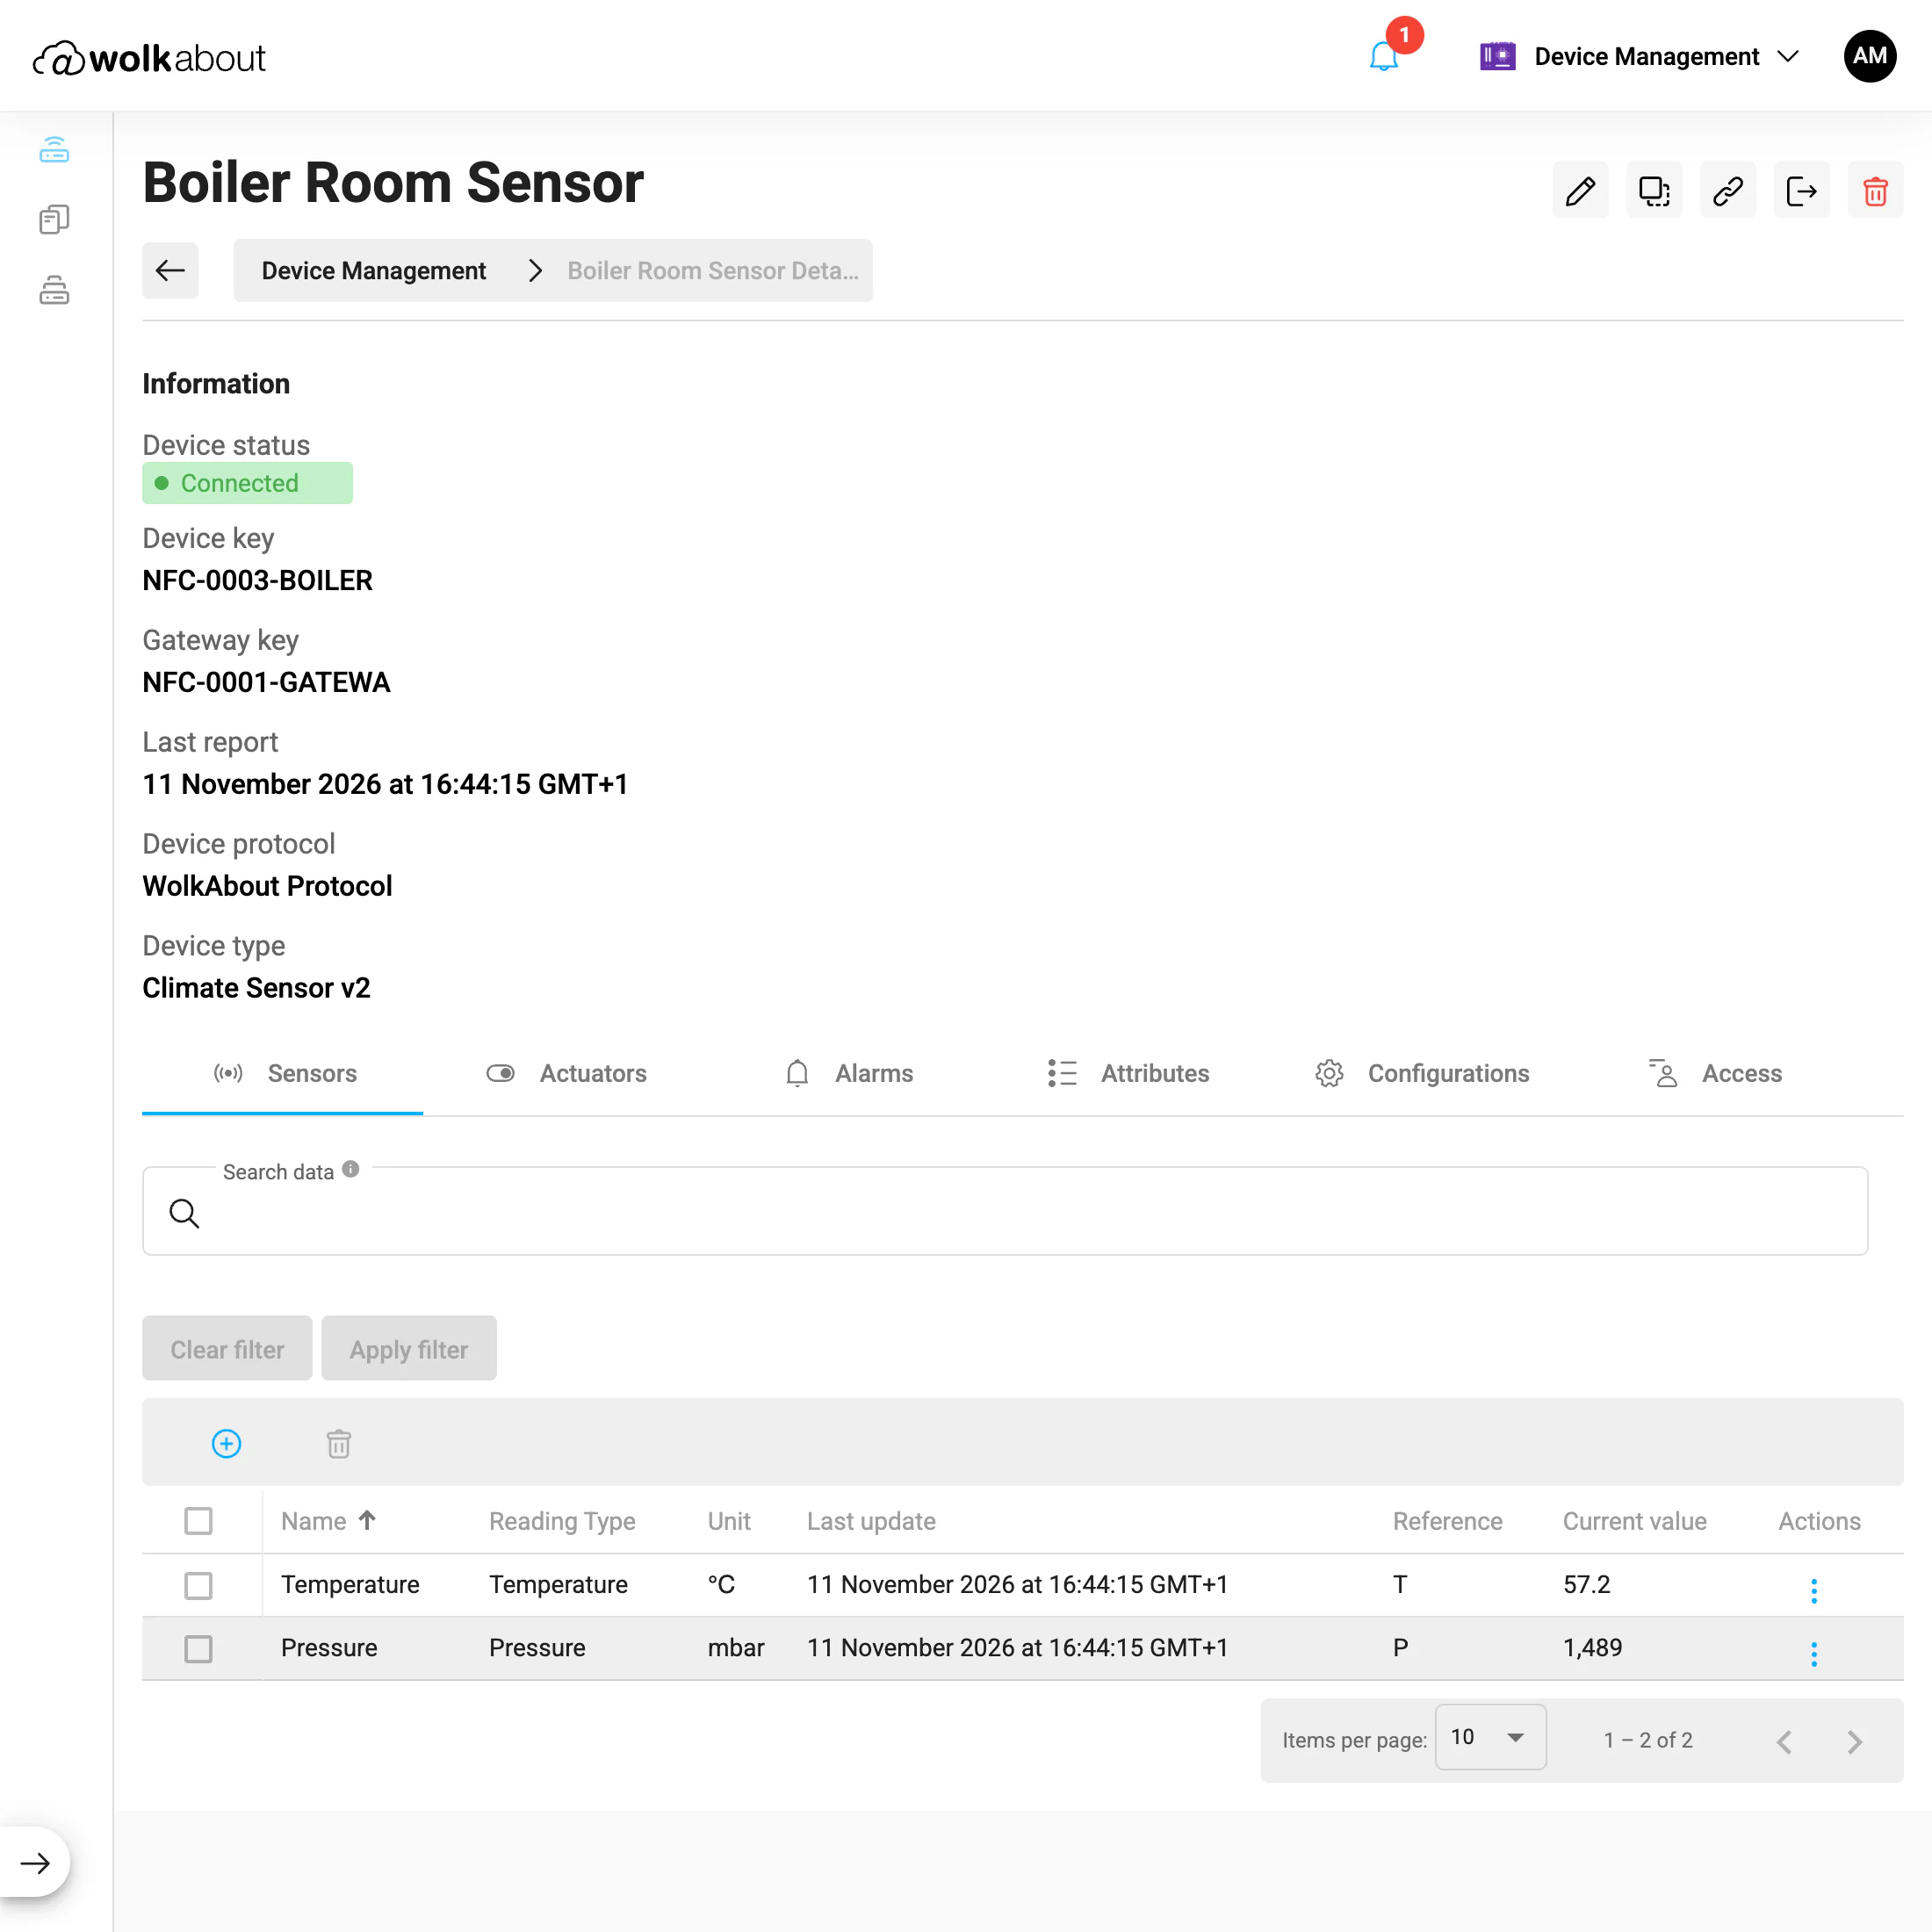
The device page "Boiler Room Sensor" in Device Management: status Connected, its device and gateway keys, last report, protocol and type at the top; below them tabs for Sensors, Actuators, Alarms, Attributes, Configurations and Access, and a table of two sensors, Temperature at 57.2 °C and Pressure at 1,489 mbar.
One device: its status and keys, and its sensors with their last values. Run in 2026 from a 2021 build, with invented data.
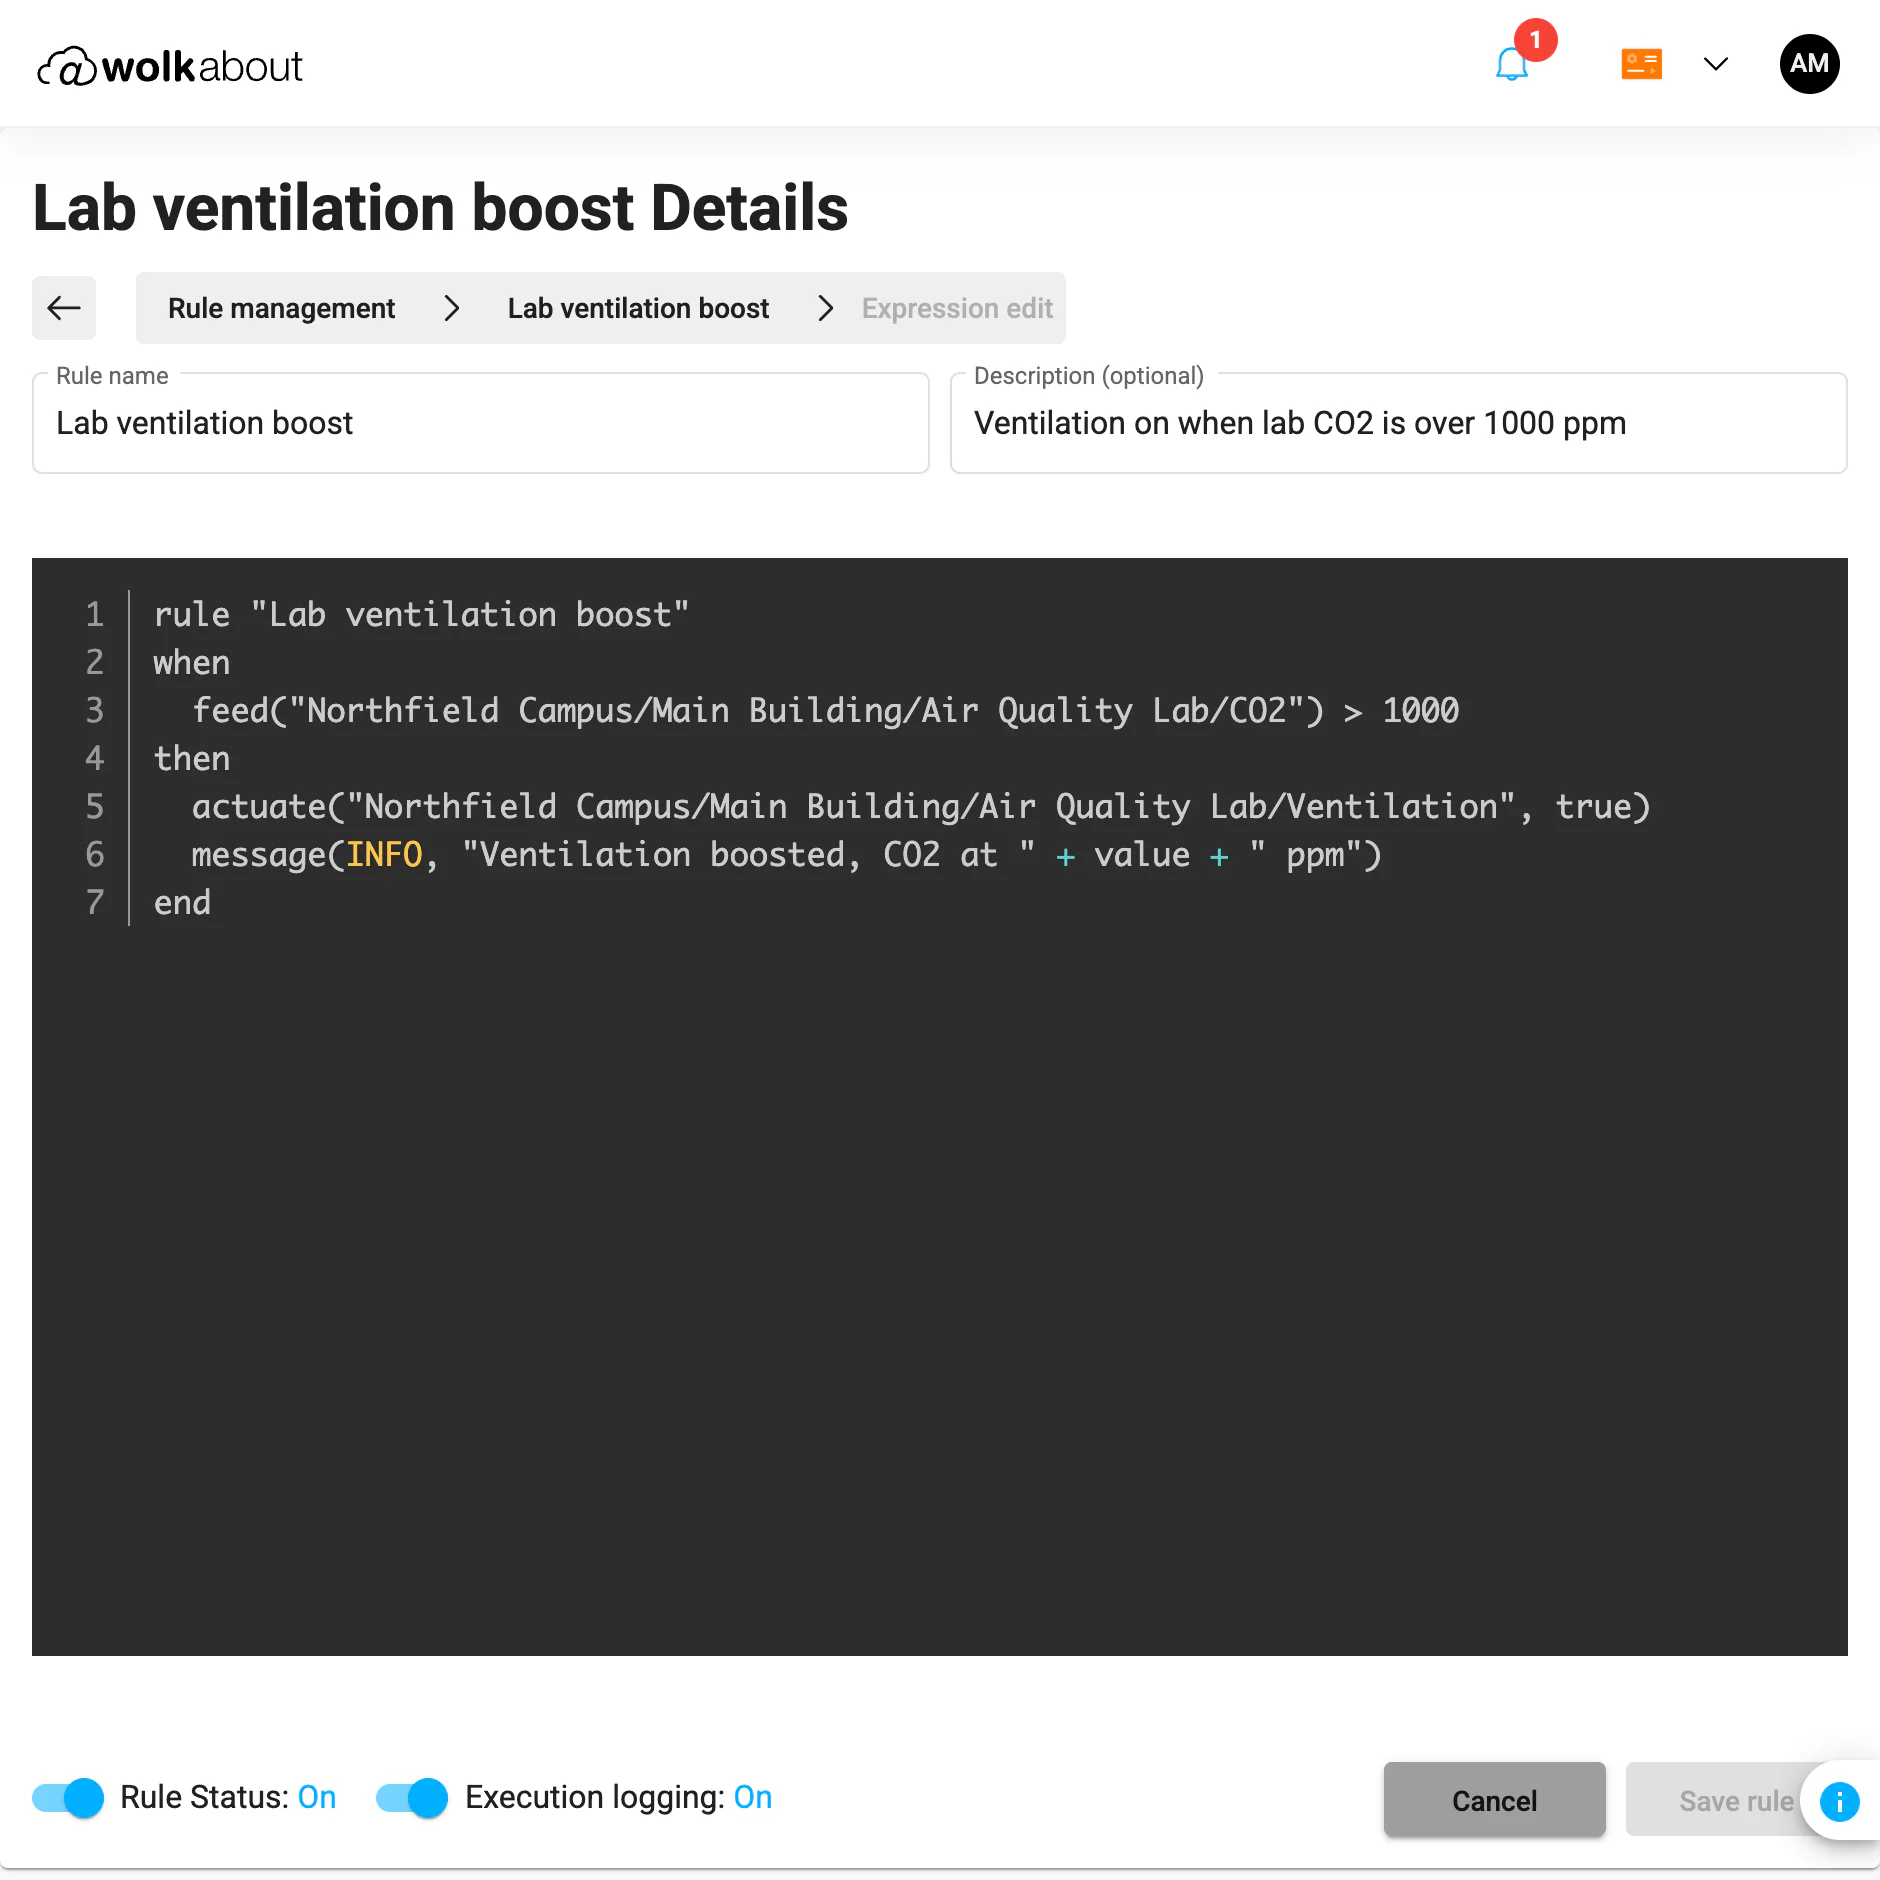
The Rule Engine editor for a rule called "Lab ventilation boost": a name, a description, and a dark code editor with seven lines that read, in short, when the CO2 feed of the Air Quality Lab is above 1000, turn its ventilation on and send an info message. Toggles below for rule status and execution logging.
A rule in the platform's own rule language: when the lab's CO2 goes over 1000, switch the ventilation on. Run in 2026 from a 2021 build, with invented data.
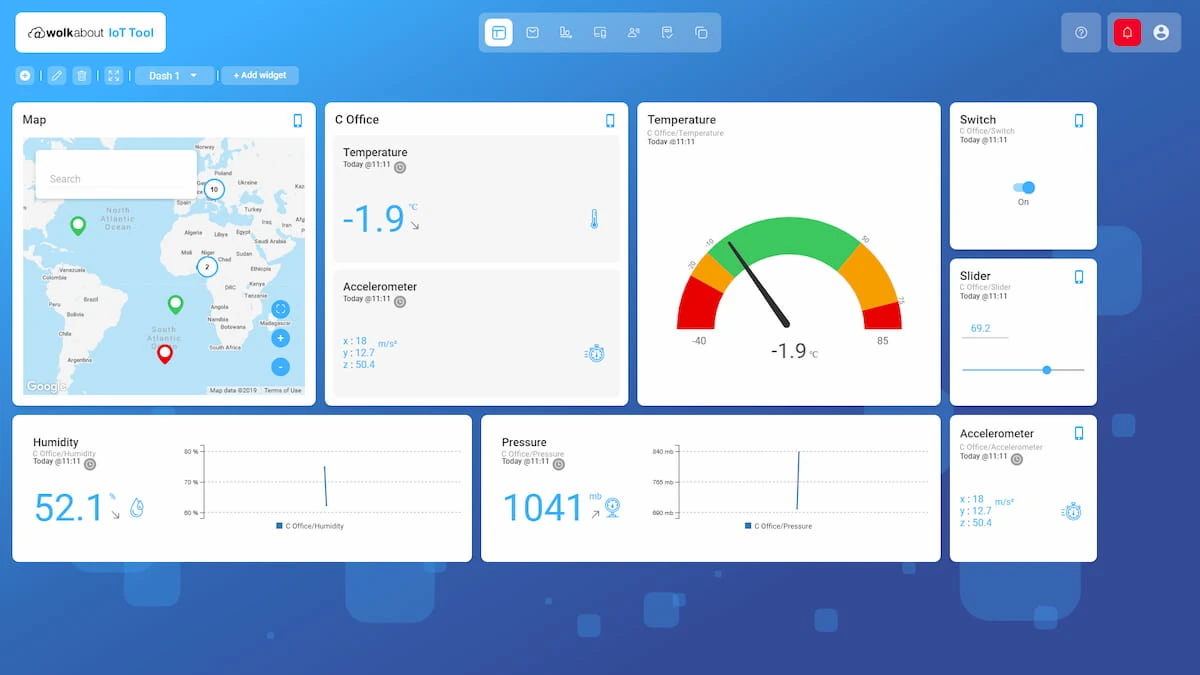
The "WolkAbout IoT Tool" in 2019, on a blue background: a dashboard with a world map of device pins, temperature and accelerometer readings for a demo device called "C Office", a temperature gauge at -1.9 °C, a switch, a slider, and humidity and pressure charts.
WolkAbout's own product screenshot, 2019: a dashboard from my years there, as the company's website showed it.